LoadSync™
LoadSync™ is the building management software for your loadcenter. For hardware setup and UPS connections, see the Loadcenter Guide.
LoadSync™ can be accessed remotely with the remote access web UI. Please contact us for the login.
Navigation
The LoadSync™ interface uses a sidebar on the right side of the screen for navigating between pages. The available pages depend on your loadcenter's hardware configuration.
Variable pages
LoadSync™ automatically selects which pages to display based on what type of unit you have.
By default, the following pages will display:
- Overview
- Miners
- Graphs
- Alarms
- System
Depending on what devices are communicating with LoadSync™, the follow pages may also appear:
- Climate
- Power
- Engine
- Market Sync
Missing pages/devices
If LoadSync™ is having trouble communicating with a device, it may be missing some pages.
Sometimes this can be rectified by running rediscovery, located on the System page under Advanced.
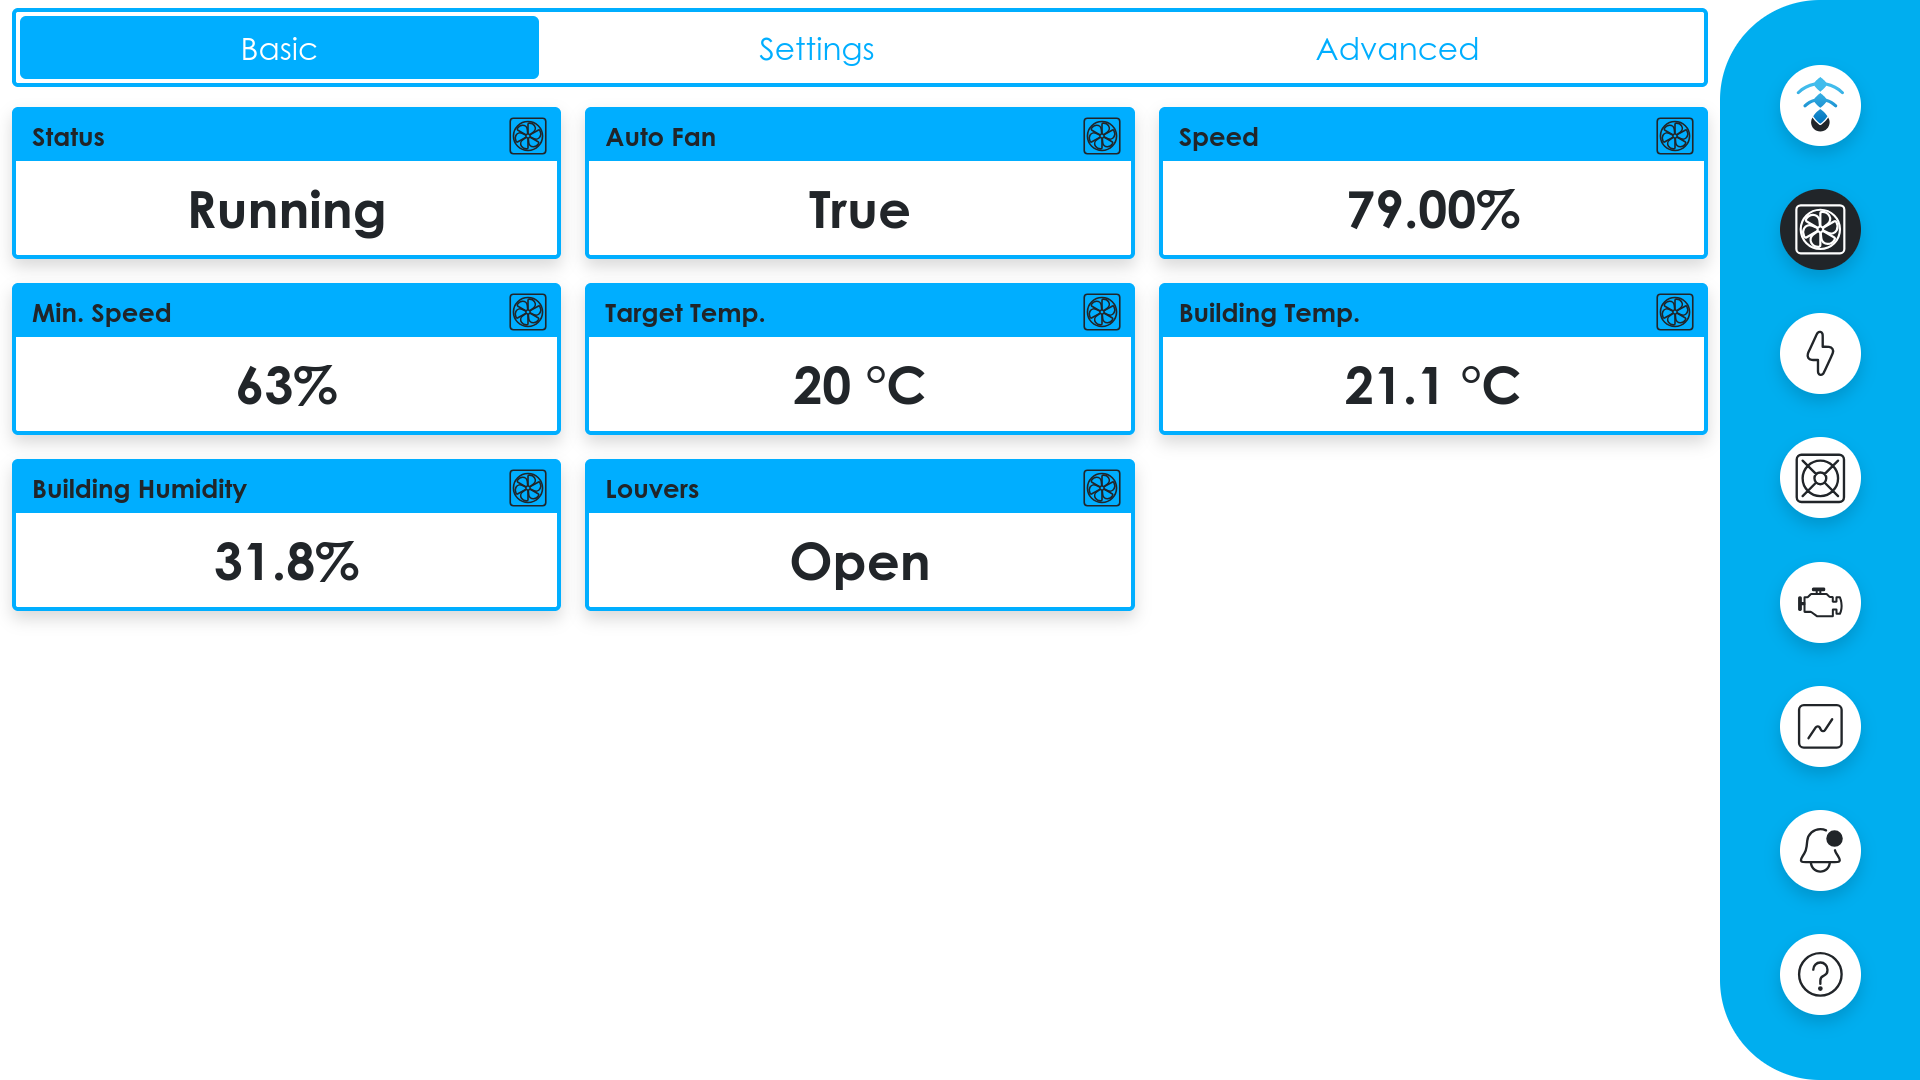
Overview
The overbiew page provides a quick overview of your loadcenter's status:
-
Summary
- Fan status
- Fan speed
- Building temperature
- Louver state
- 3-phase amperage
- Voltage
Hash Generator only
- RPM
- Temperature
- Oil Pressure
- Gas Pressure
- Battery Voltage
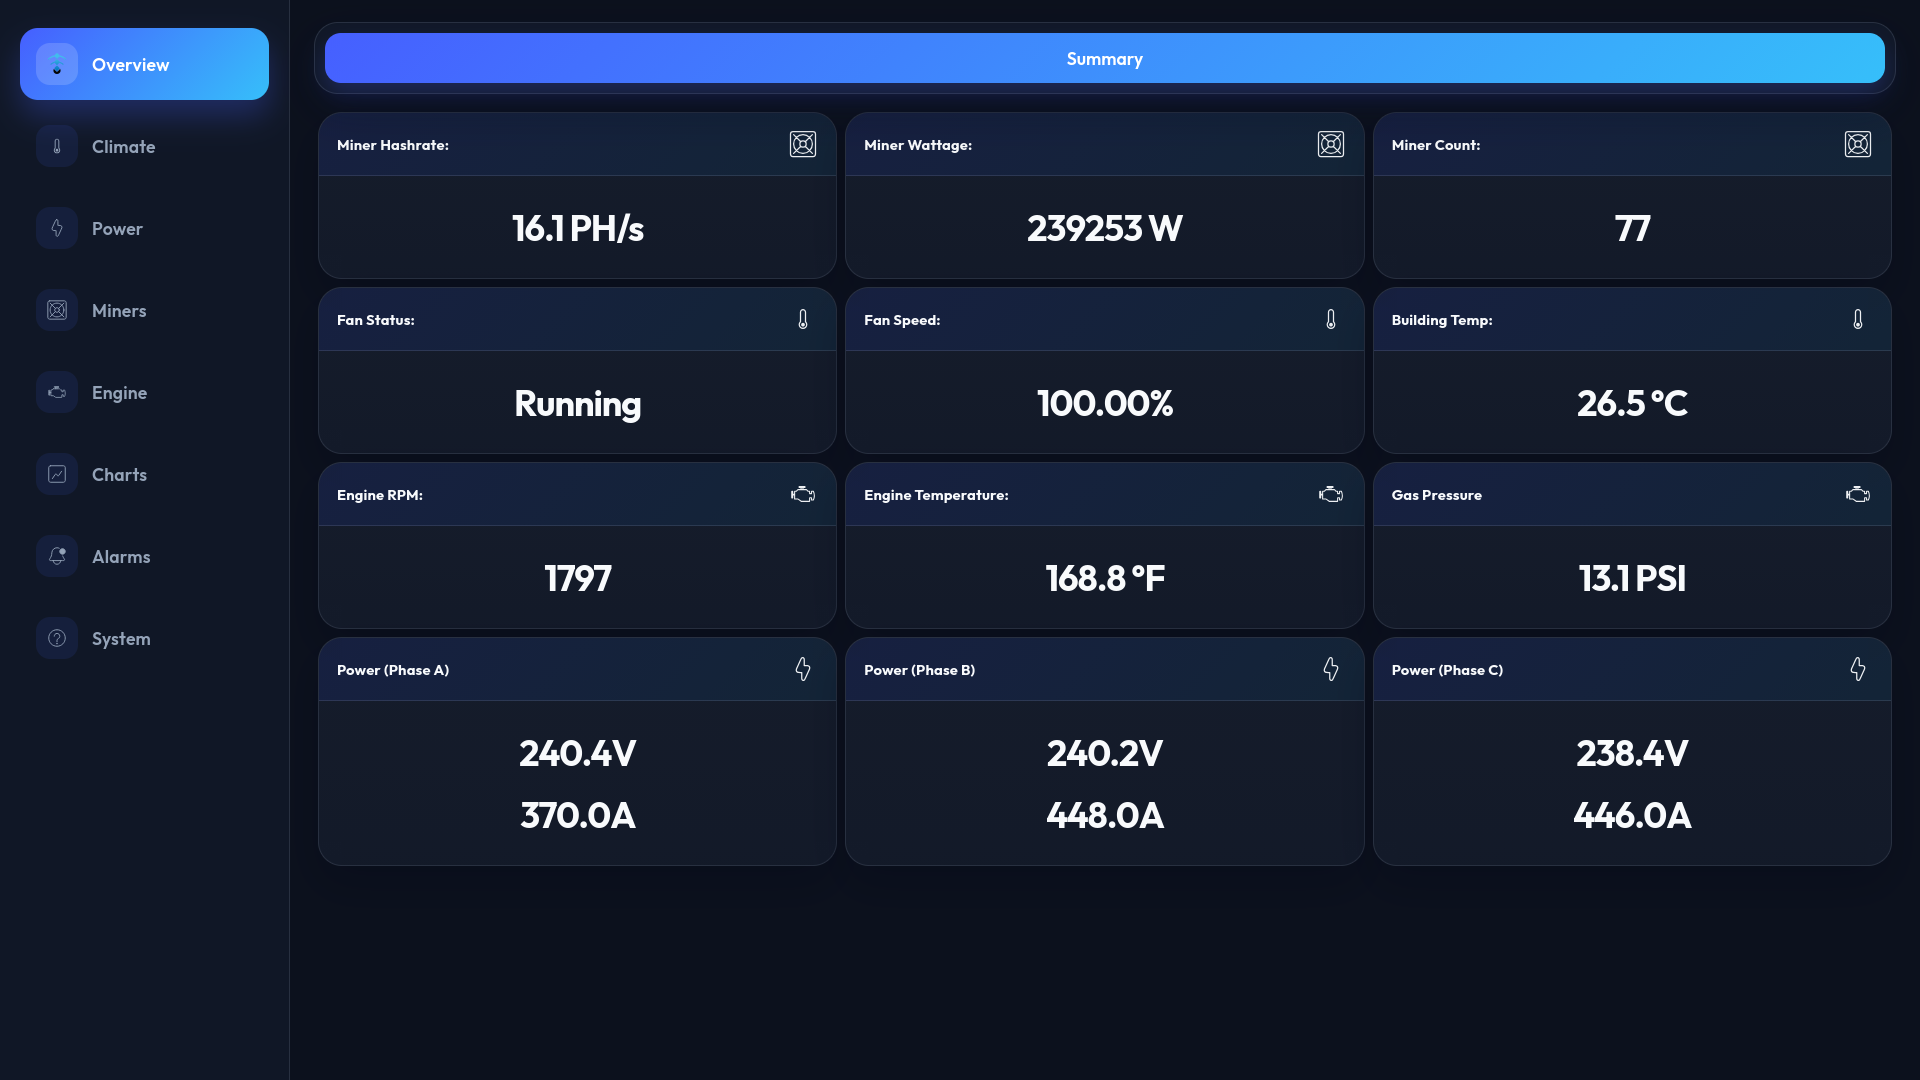
Summary tab
Miners
The miners page displays a fleet overview of all discovered miners in a table with the following columns:
- IP Address
- Hashrate
- Temperature
- Wattage
- Efficiency
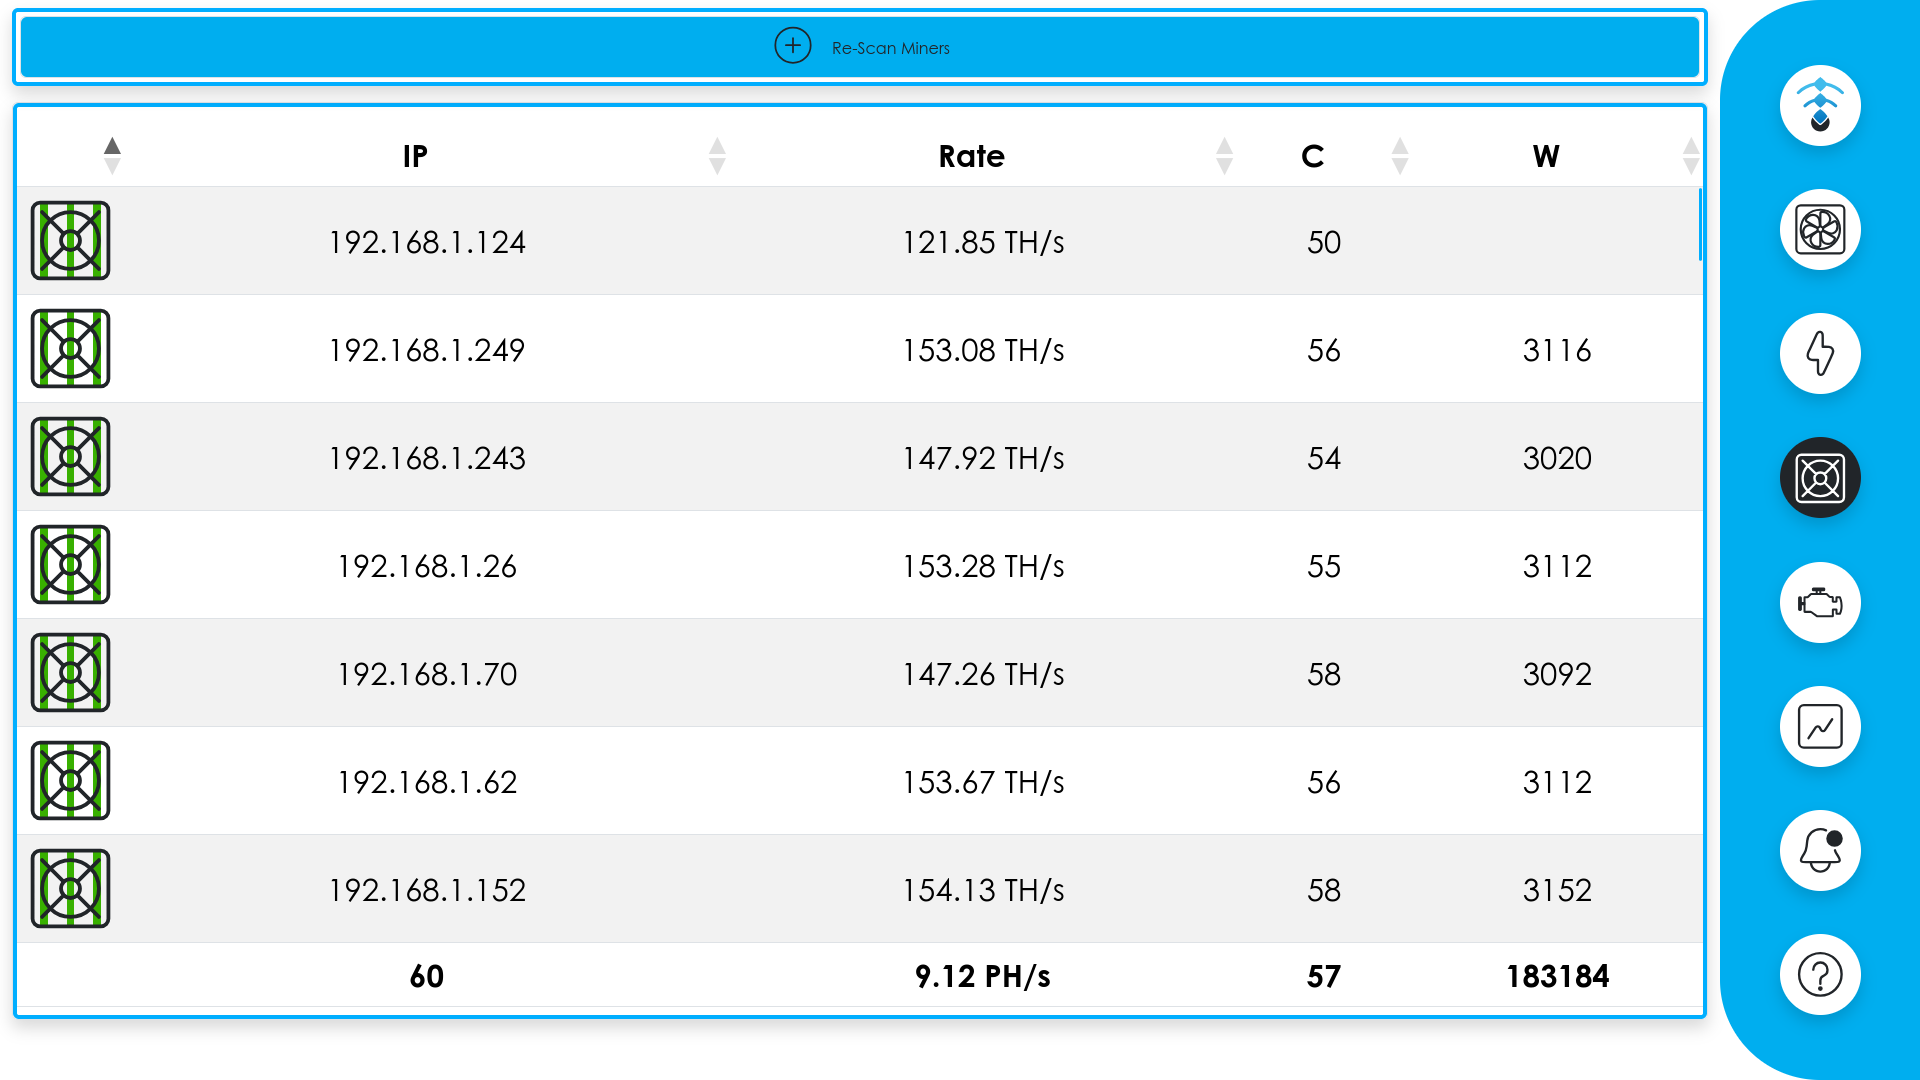
Miners page
Scanning for Miners
To discover miners on the network, click the Re-Scan Miners button at the top of the page. LoadSync™ will scan the local network and populate the table with any miners it finds.
Note
LoadSync™ automatically searches for miners on startup, so this may not even be required unless there are miners missing from the list.
Individual Miner Controls
Miner Details
Clicking on a miner's IP address in the fleet table opens a detailed view with the tabs described below.
Displays real-time miner metrics:
-
Hashrate
Current mining speed
-
Board Temperatures
Temperature readings per hashboard
-
Wattage
Current power consumption
-
Efficiency
Watts per terahash (W/TH)
-
Uptime
Time since last restart
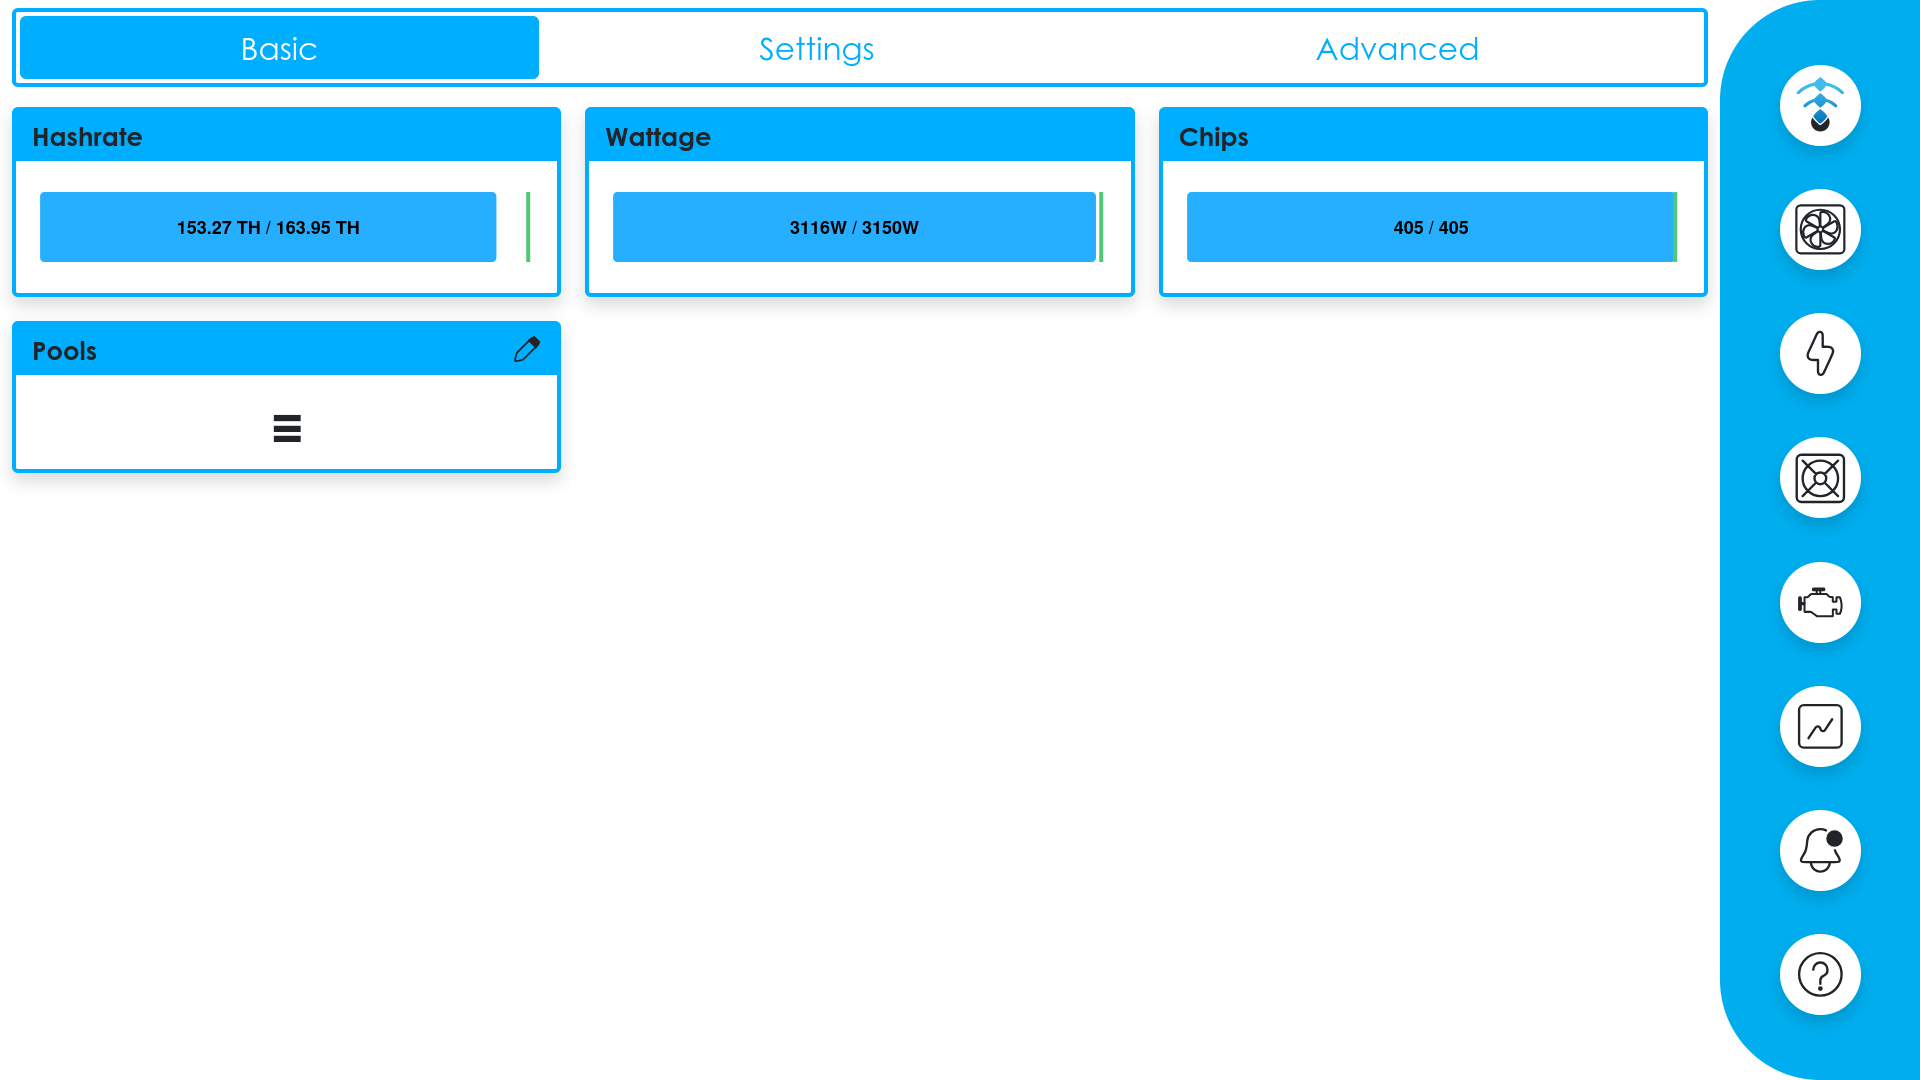
Miner basic tab
Provides controls for the miner:
-
Power Limit
Adjust the wattage limit
-
Enable/Disable Mining
Toggle mining on or off
-
Fault Light
Toggle the miner's fault indicator LED
-
Reboot
Restart the miner
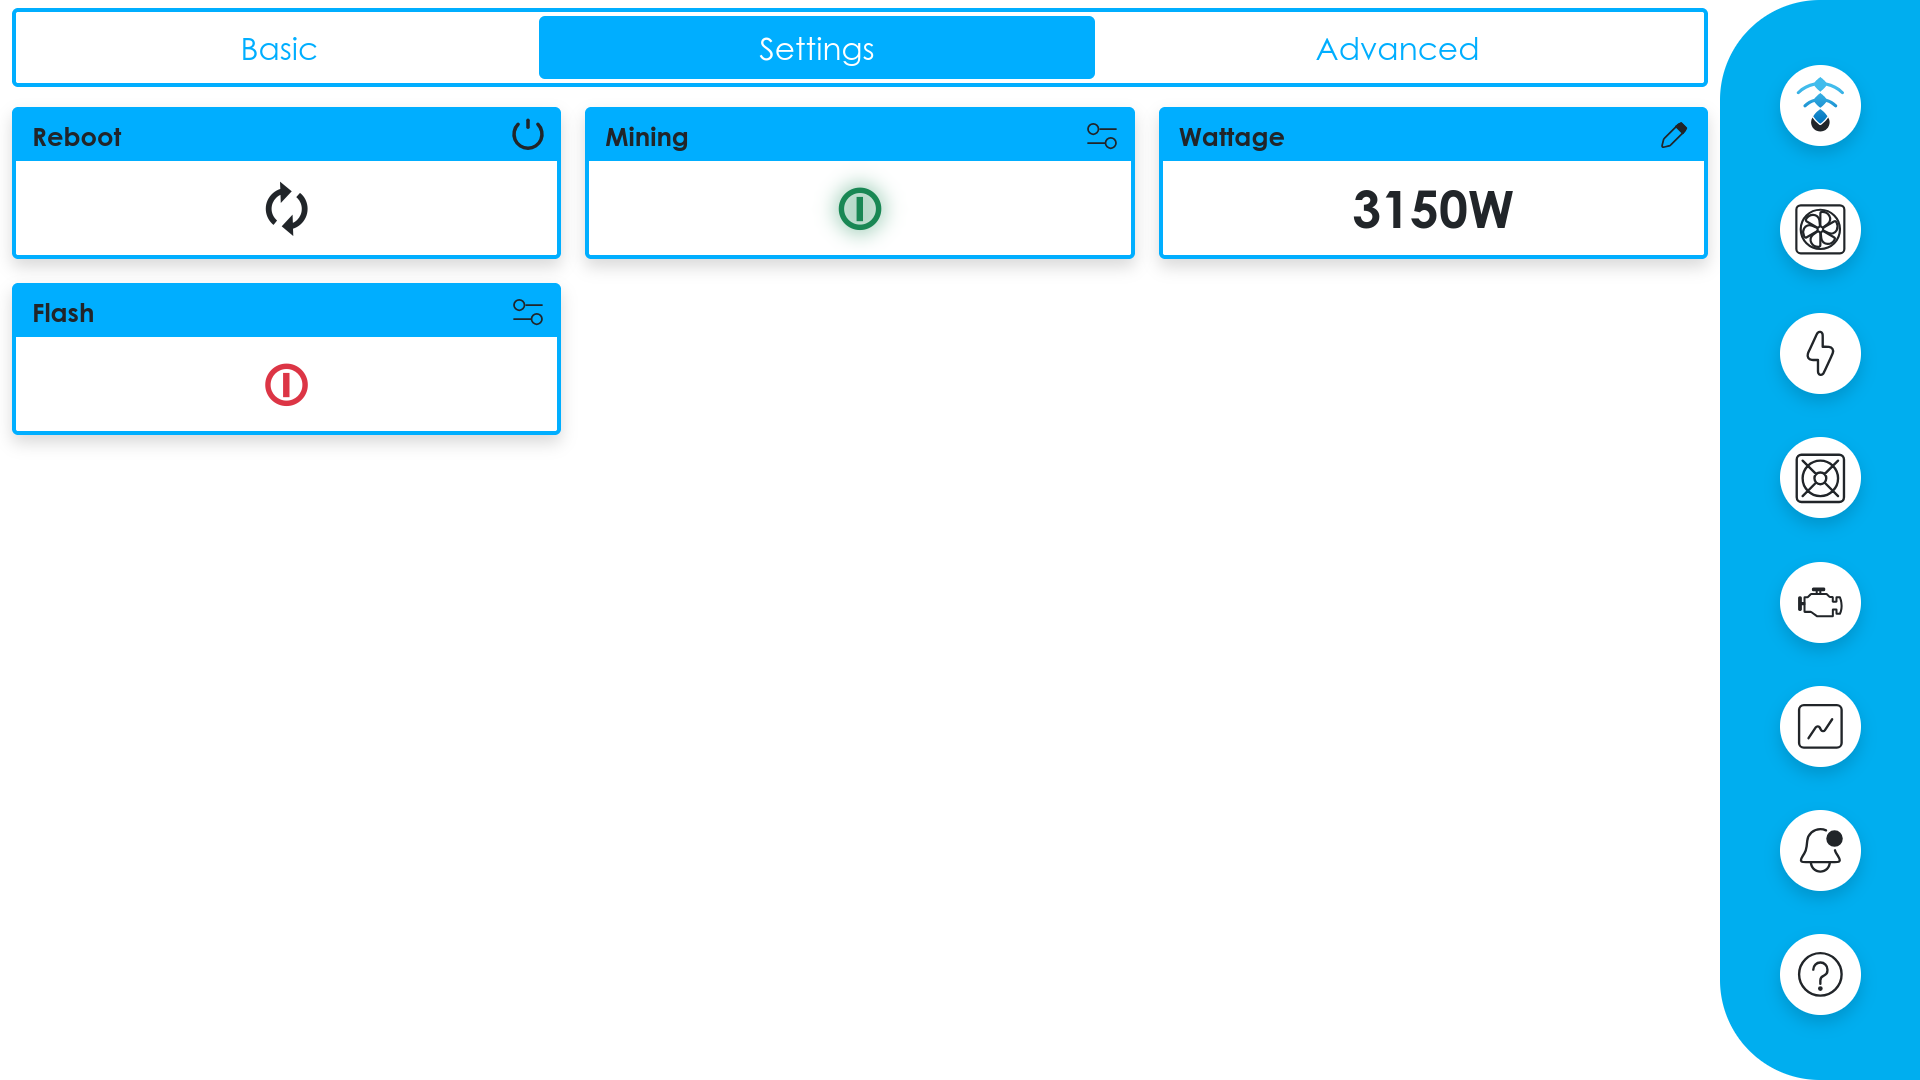
Miner settings tab
Shows additional diagnostic data for the miner.
Climate
The climate page monitors and controls the loadcenter's ventilation system. It is organized into tabs:
Displays current climate readings:
-
Fan Status
Whether the fan system is running
-
Fan Speed
Current speed as a percentage (0–100%)
-
Building Temperature
Current internal temperature
-
Building Humidity
Current internal humidity
-
Louver State
Whether the building louvers are open or closed
Climate basic tab
Provides controls for the fan system:
-
Fan Enabled
Turn the fan system on or off
-
Fan Auto
Toggle automatic temperature-based fan control
-
Min. Speed
Set the minimum fan speed (0–100%)
-
Target Temp.
Set the target temperature for auto mode
Auto Mode Behavior
When auto mode is enabled, the fans will automatically adjust speed to maintain the target temperature. When disabled, fans run at the minimum speed setting.
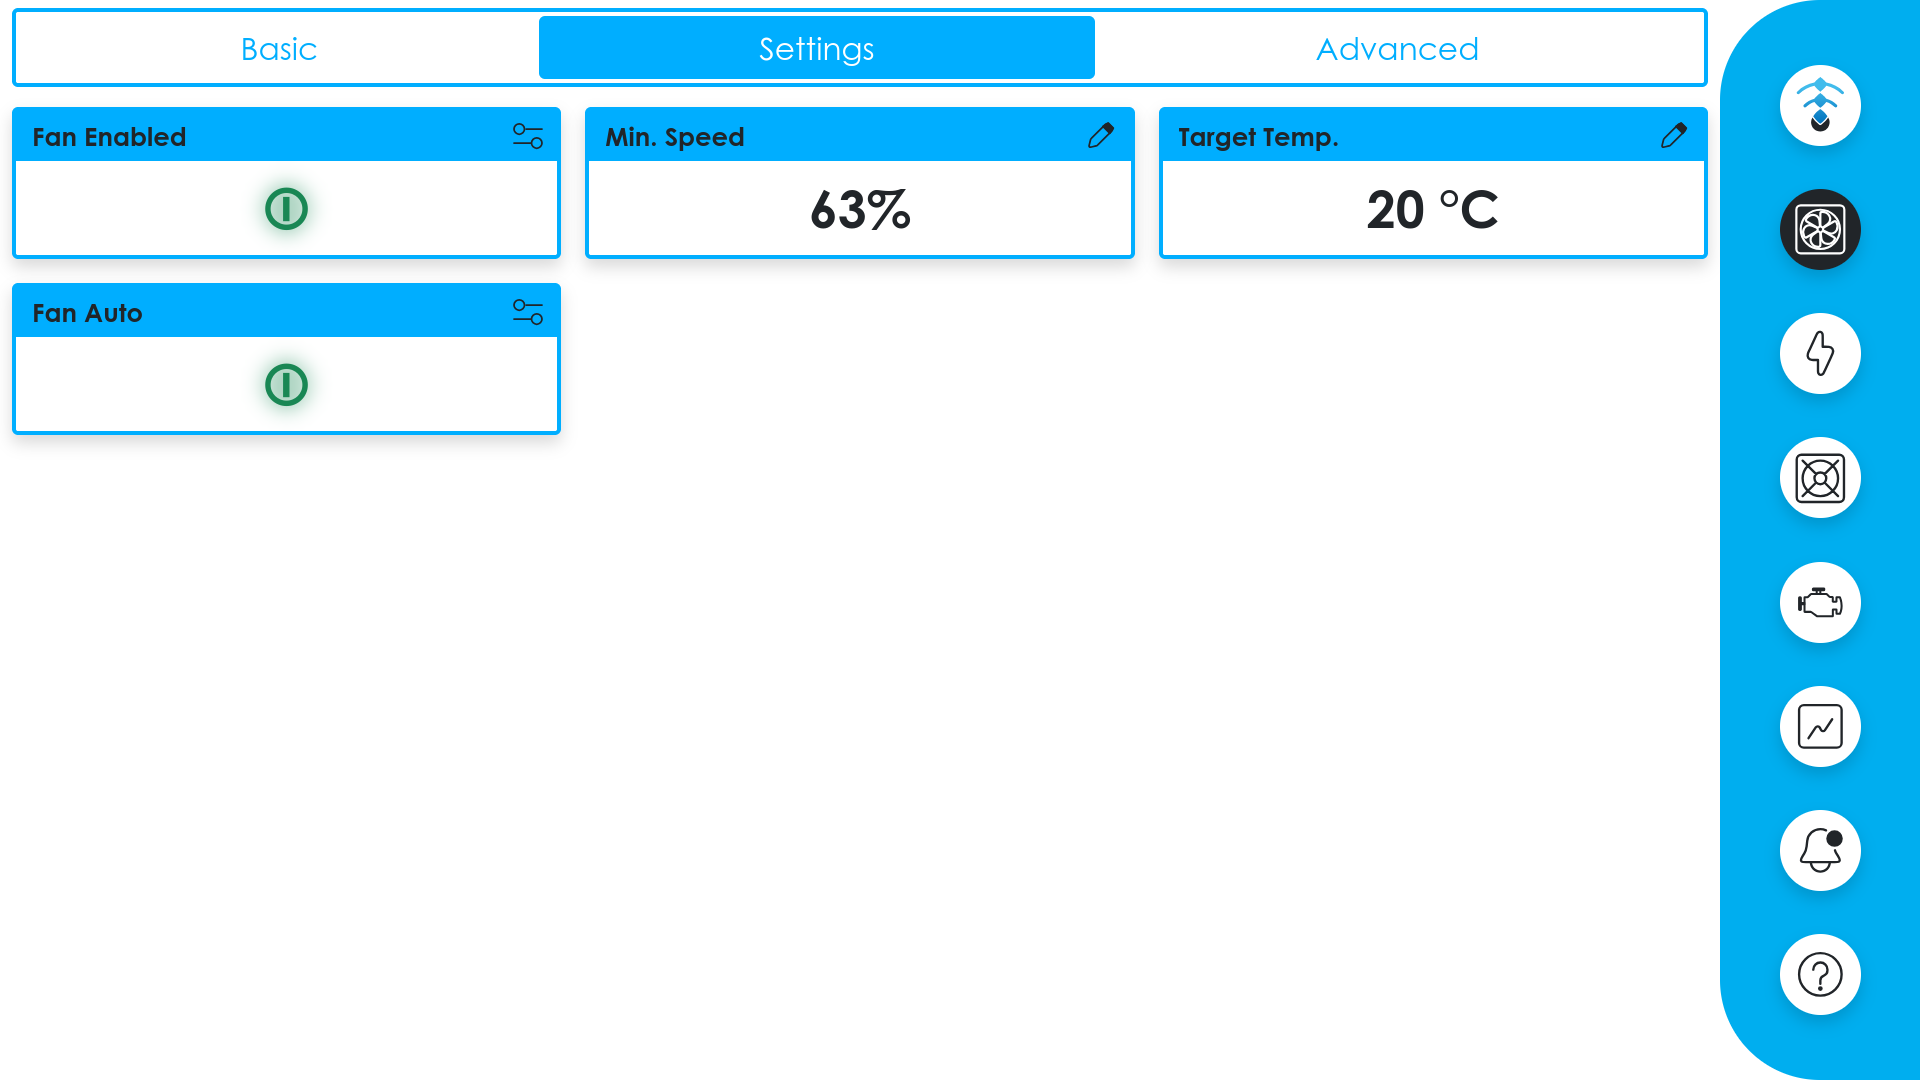
Climate settings tab
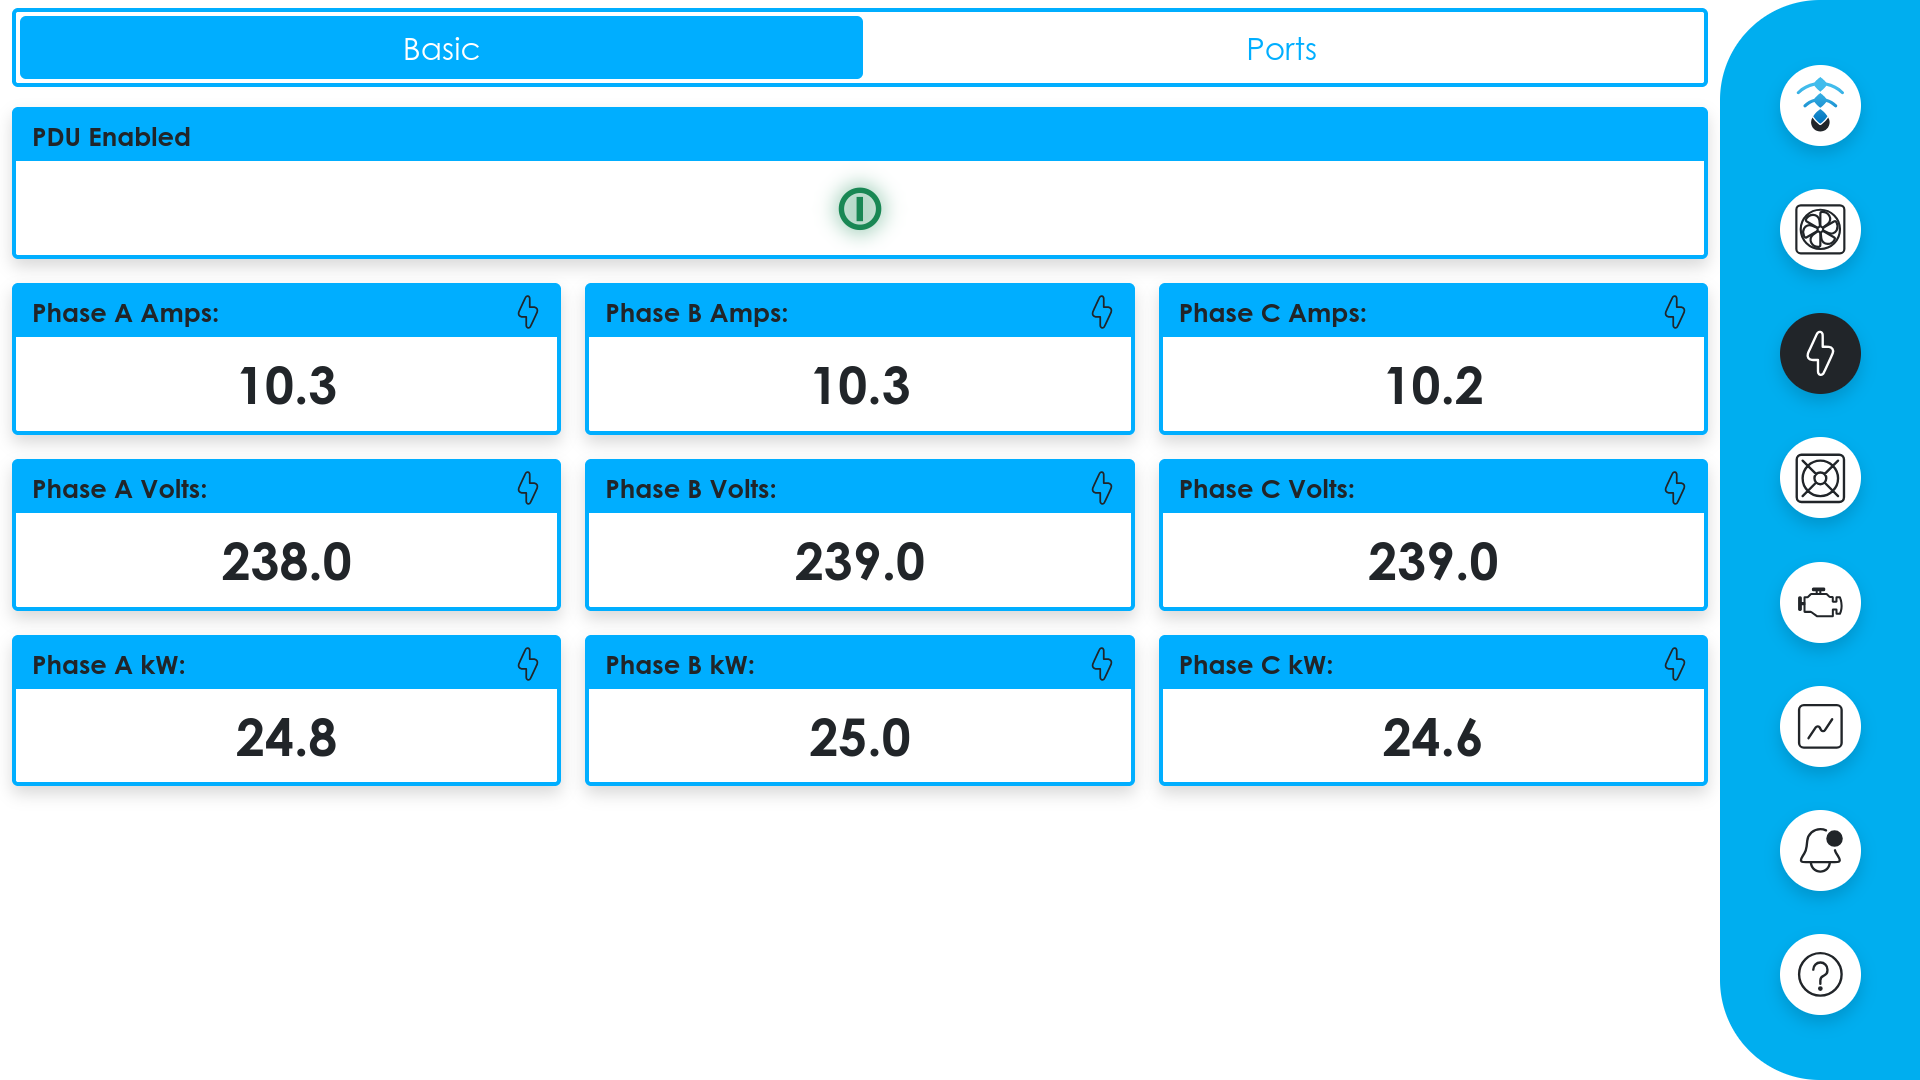
Power
The power page monitors the loadcenter's power distribution units (PDUs) and electrical output.
Displays per-phase power data:
-
Amperage
Current draw per phase
-
Voltage
Voltage per phase
-
Kilowatts
Power output per phase
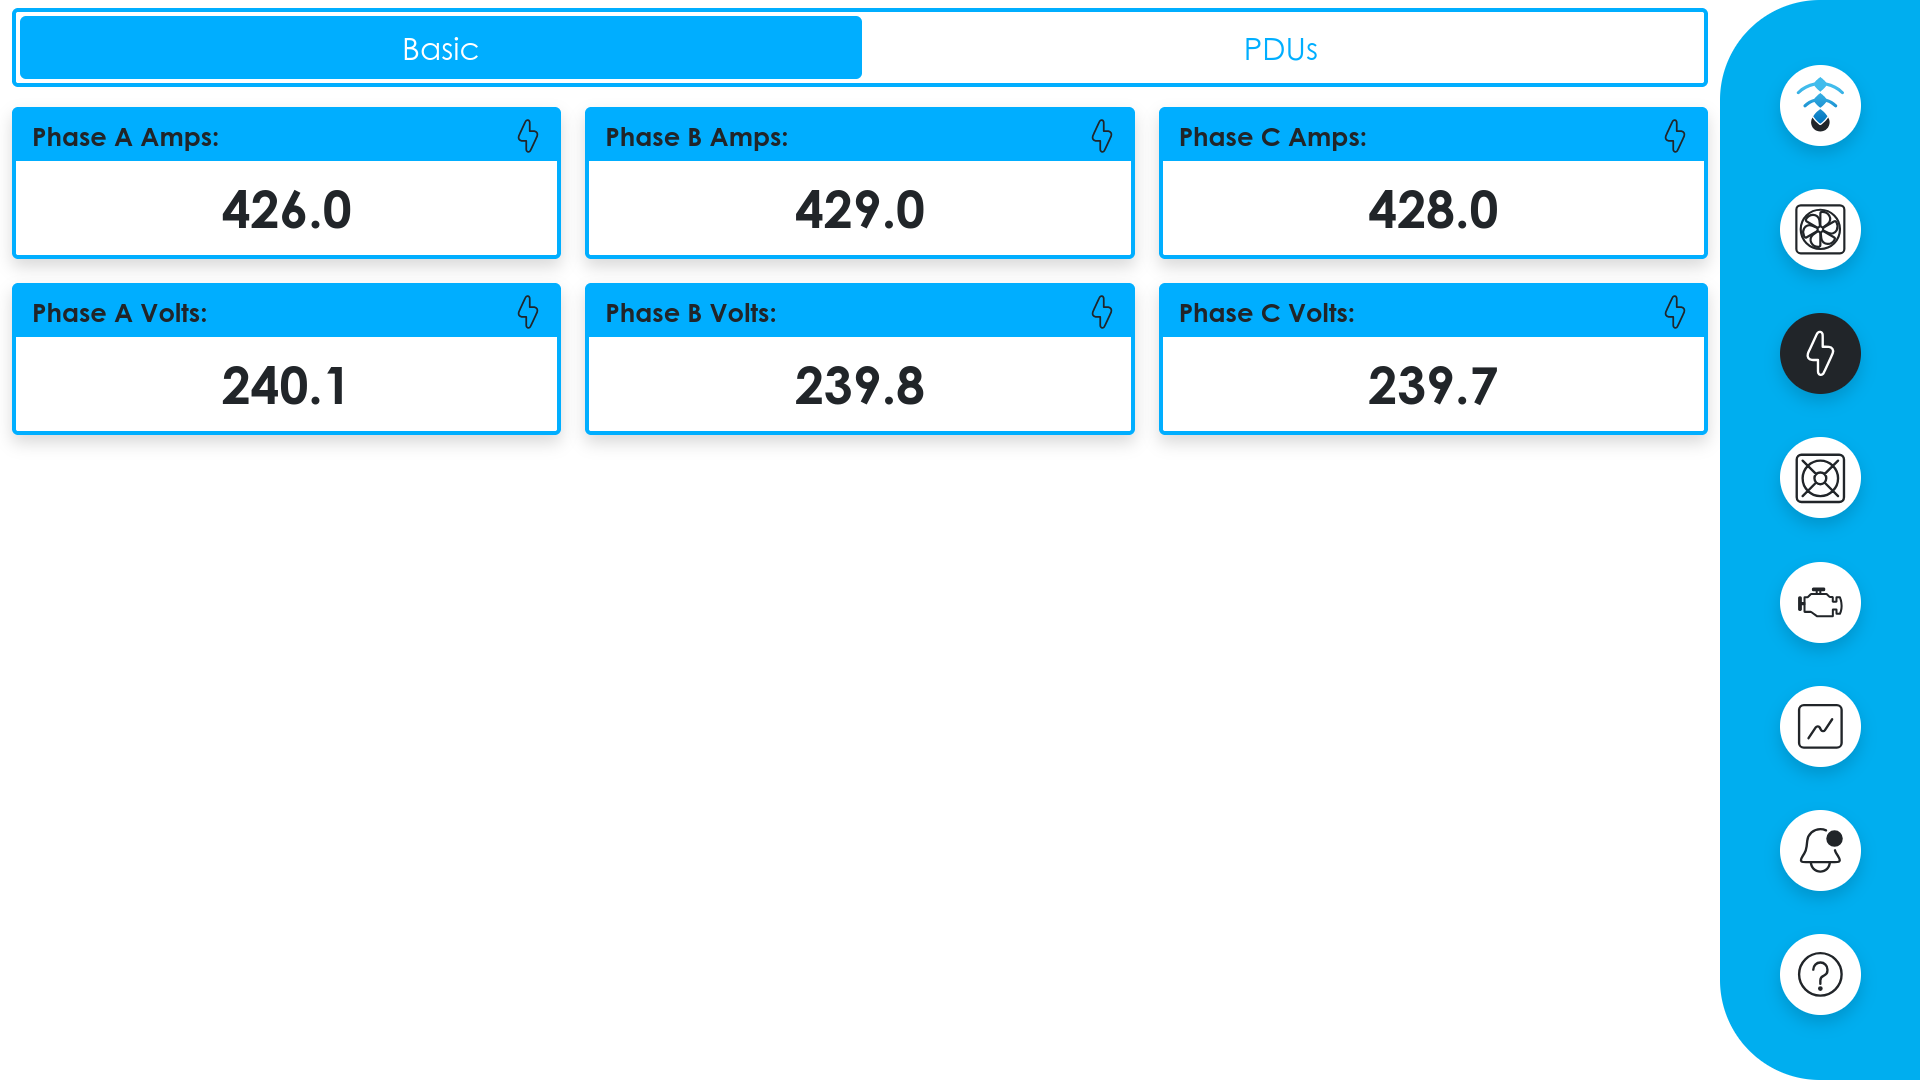
Power basic tab
Lists all connected PDUs with their status.
PDU Details
Clicking on an individual PDU shows detailed port-level information including per-phase amperage, voltage, and kilowatt readings.
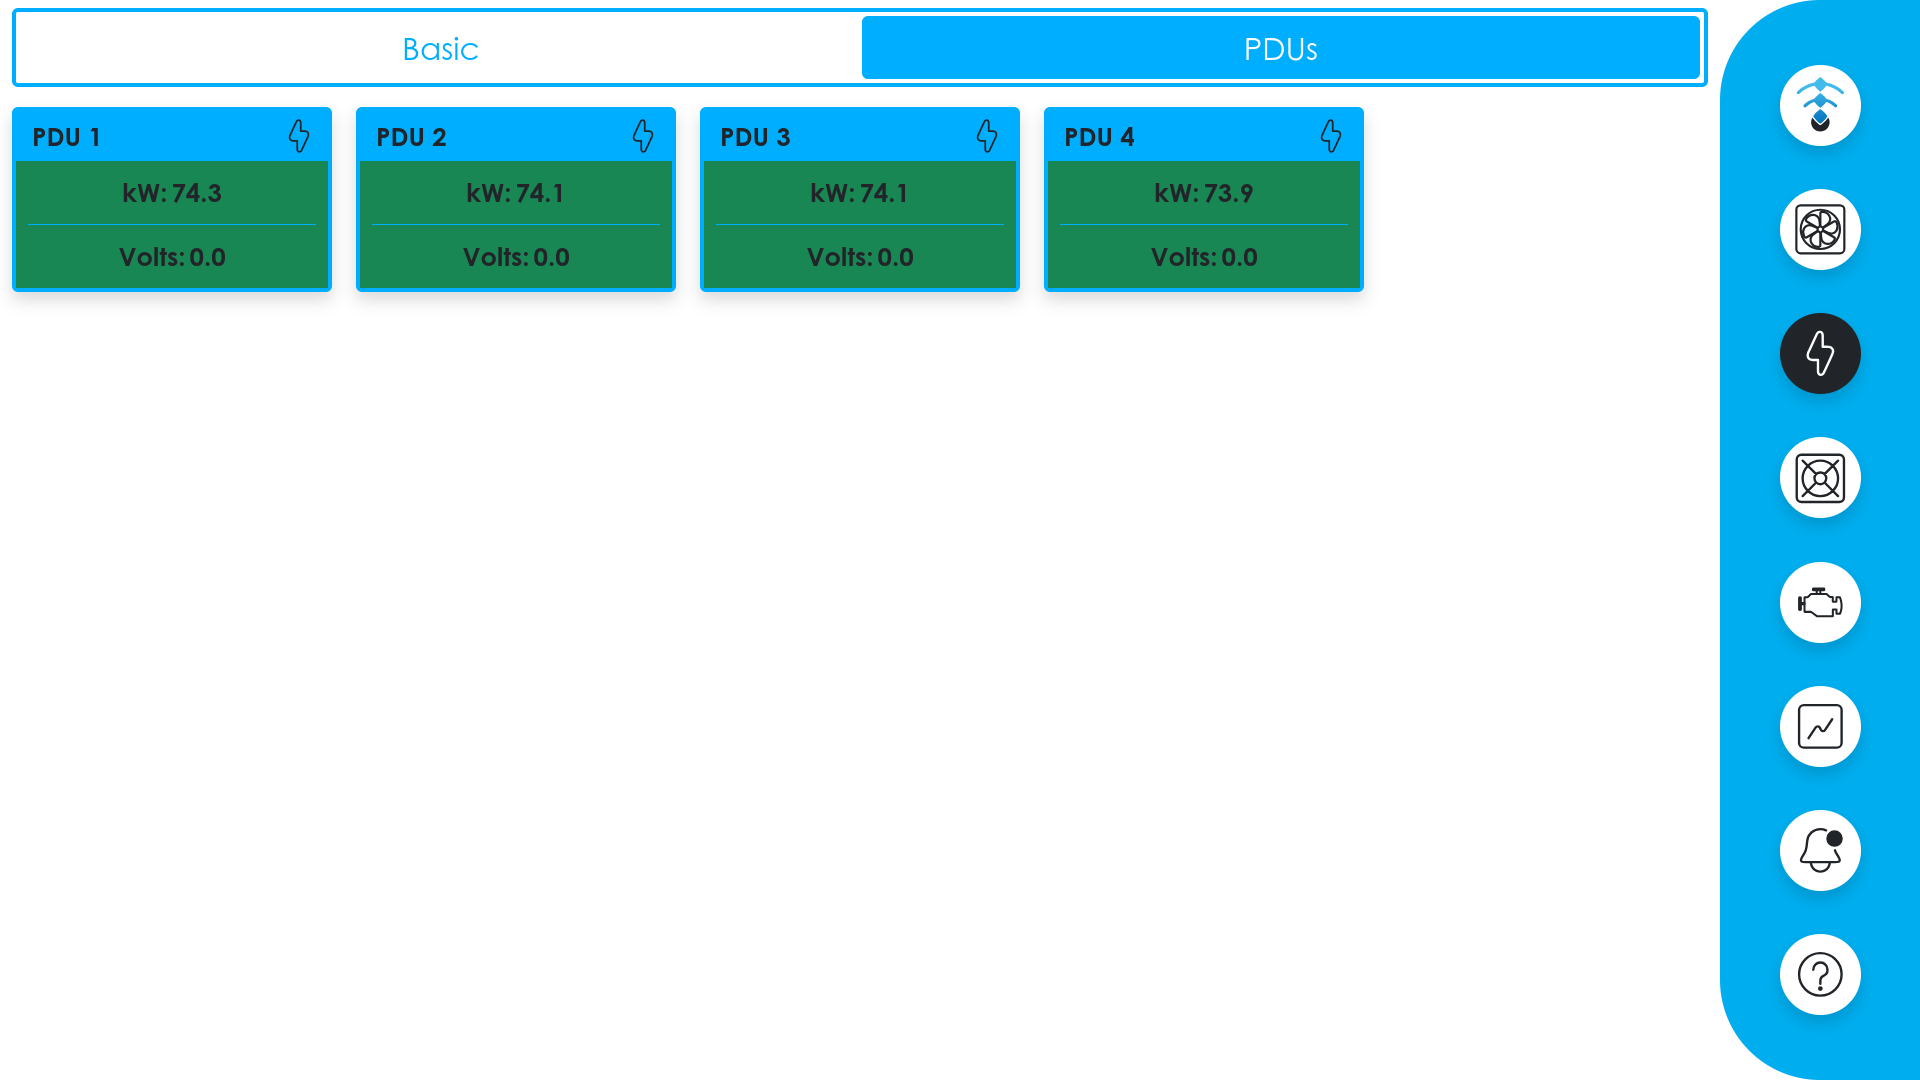
PDU list
PDU details
Engine
Info
The engine page is only available on loadcenters equipped with an engine/generator.
The engine page monitors and controls the loadcenter's generator. It is organized into tabs:
Displays real-time engine metrics:
-
RPM
Current engine speed
-
Temperature
Engine temperature
-
Oil Pressure
Current oil pressure
-
Gas Pressure
Current gas pressure
-
Battery Voltage
Engine battery voltage
-
Phase Data
Per-phase voltage, amperage, and kilowatt output
Engine basic tab
Provides engine controls:
-
ESD (Emergency Shutdown)
Opens a confirmation dialog to shut down the engine
-
Minimum Gas Pressure Alert
Set the threshold for low gas pressure alarms
-
High Temp. Alert
Set the threshold for high temperature alarms
-
Auto Balance
When enabled, automatically distributes power across miners based on engine load
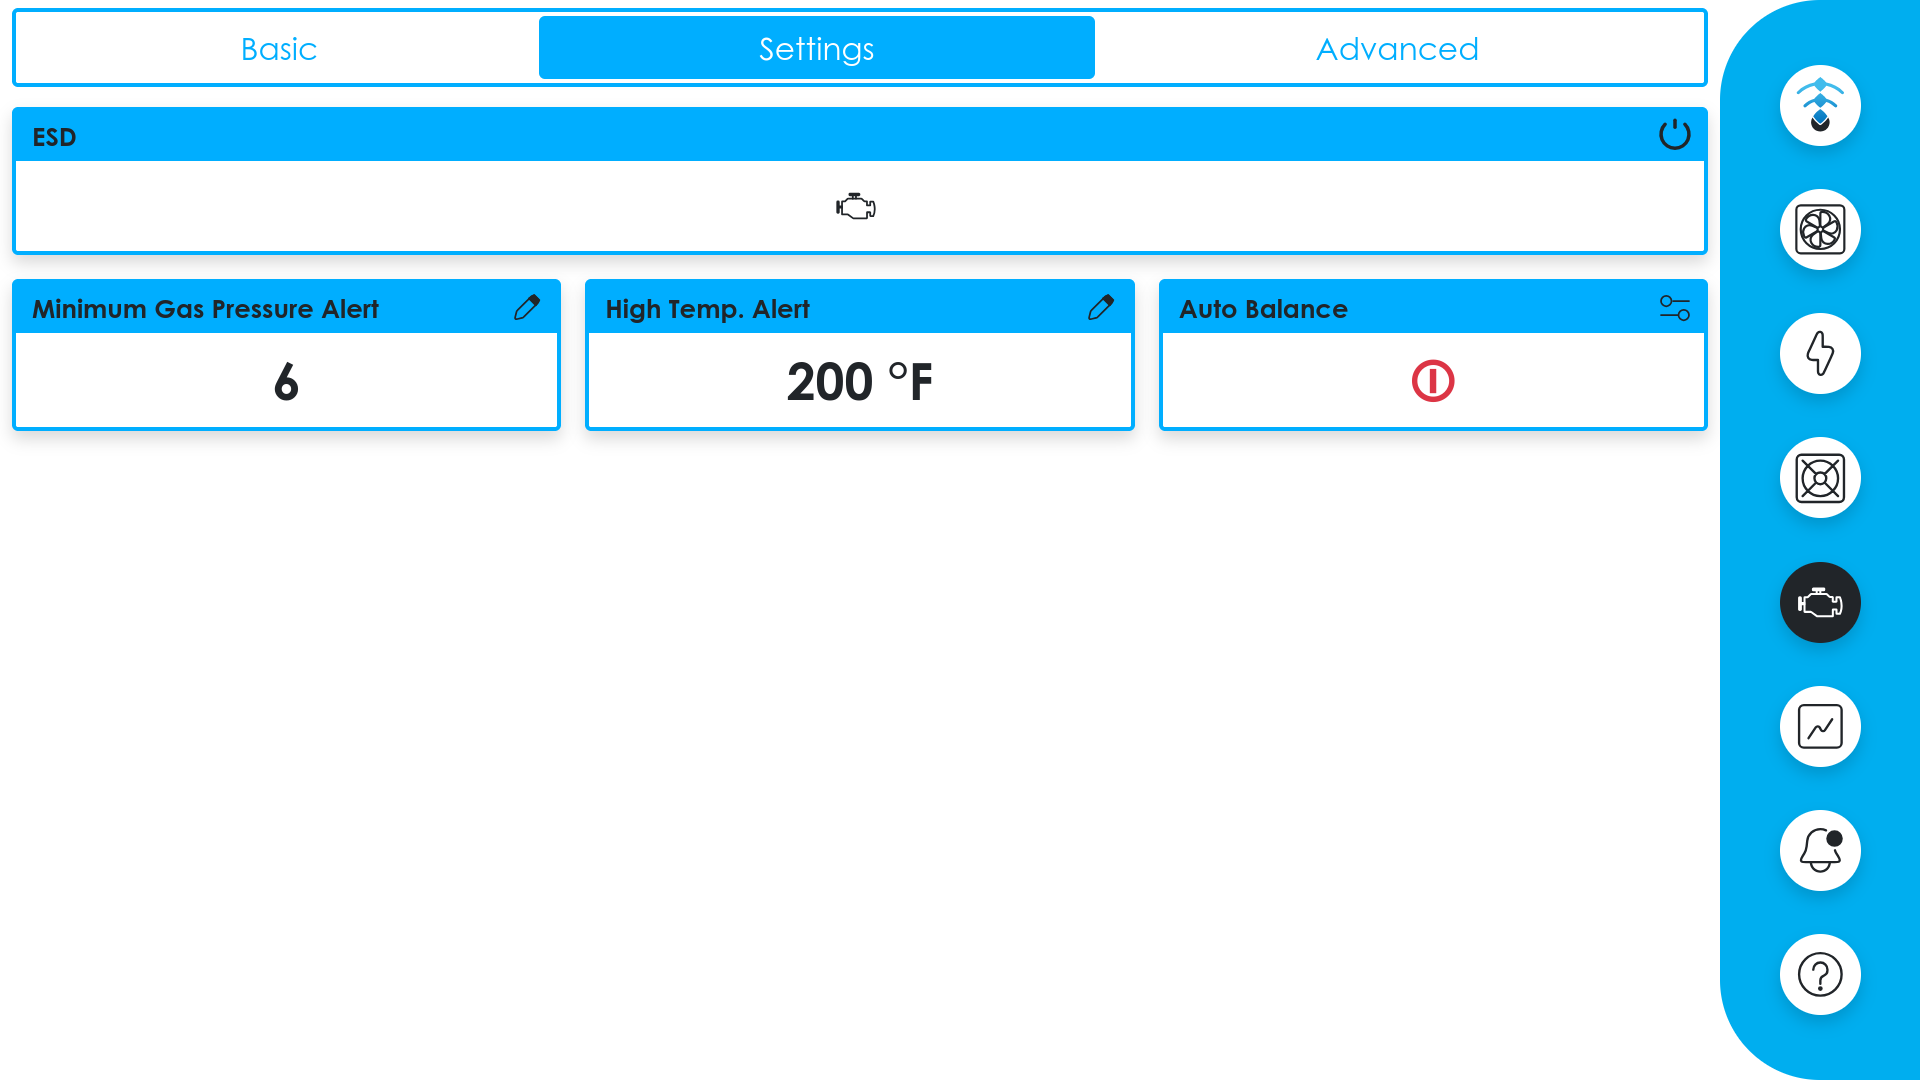
Engine settings tab
Emergency Shutdown
The ESD button will immediately shut down the engine. You will be prompted to confirm before the shutdown is executed.
Graphs
The graphs page displays historical data charts for your loadcenter's systems. The available graph categories depend on your hardware configuration and may include Engine, Power, and Climate.
Chart timeframes
Each chart supports multiple timeframe selections:
- 1 hour
- 6 hours
- 1 day
- 1 week
- 1 month
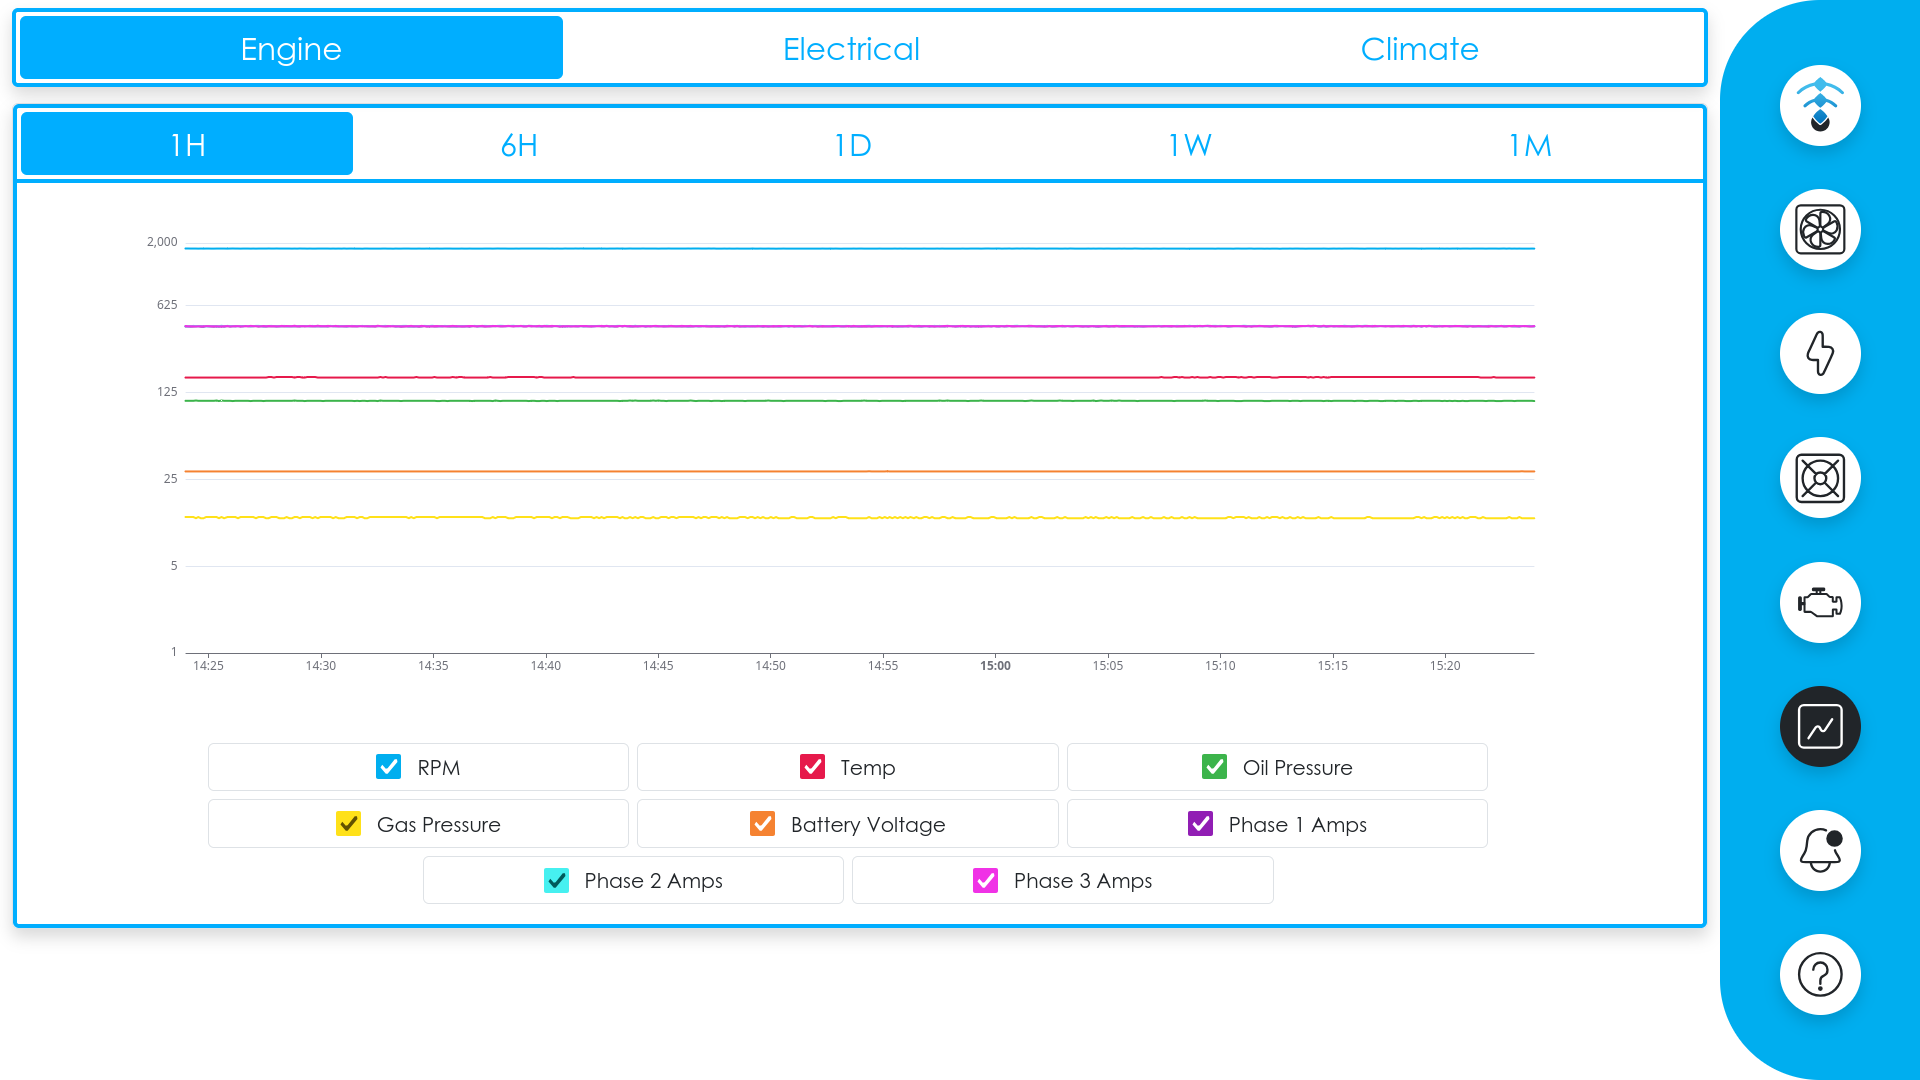
Graphs page
Engine Graphs
Displays historical charts for RPM, temperature, oil pressure, gas pressure, battery voltage, and per-phase amperage. Alarm events are highlighted on the charts as colored overlays.
Power Graphs
Displays historical charts for PDU amperage, voltage, and kilowatt readings. High-amperage alarm events are highlighted on the charts.
Climate Graphs
Displays historical charts for fan speed, building temperature, and building humidity.
Alarms
The alarms page tracks system alerts and is organized into tabs:
Shows all currently active alarms with descriptions and icons.
Shows a log of past alarms with timestamps, allowing you to review when issues occurred.
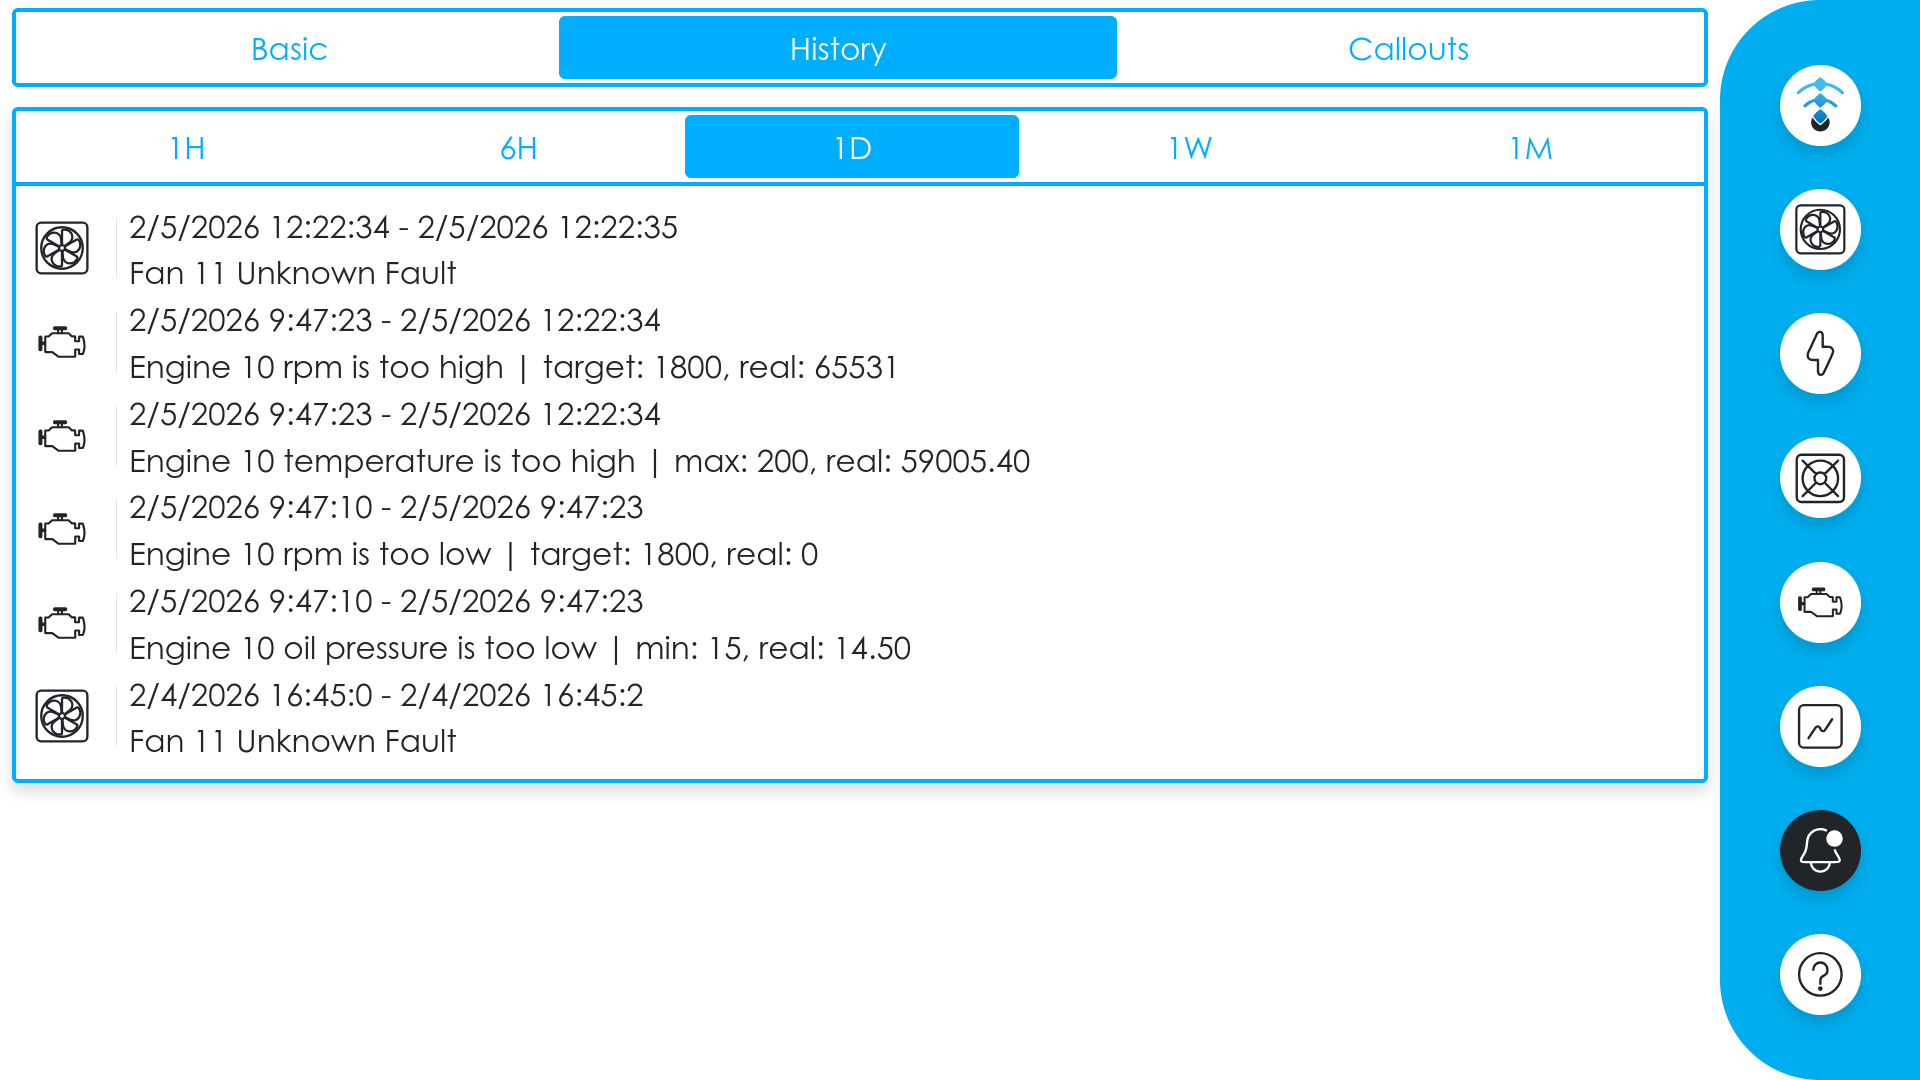
Alarm history tab
Configures external alarm notifications via ntfy.sh. When enabled, alarm events will be pushed as notifications to your device.
Alarm types include:
- Engine alarms — RPM, temperature, oil pressure, battery voltage, gas pressure
- Power alarms — High amperage on PDUs
Market Sync
Info
Market Sync is only available on loadcenters connected to the ERCOT power grid.
Market Sync allows LoadSync™ to automatically respond to real-time electricity pricing from ERCOT (Electric Reliability Council of Texas). When the price exceeds your configured limit, LoadSync™ will automatically pause mining operations and resume them when prices drop back down.
Displays the current market price and sync status.
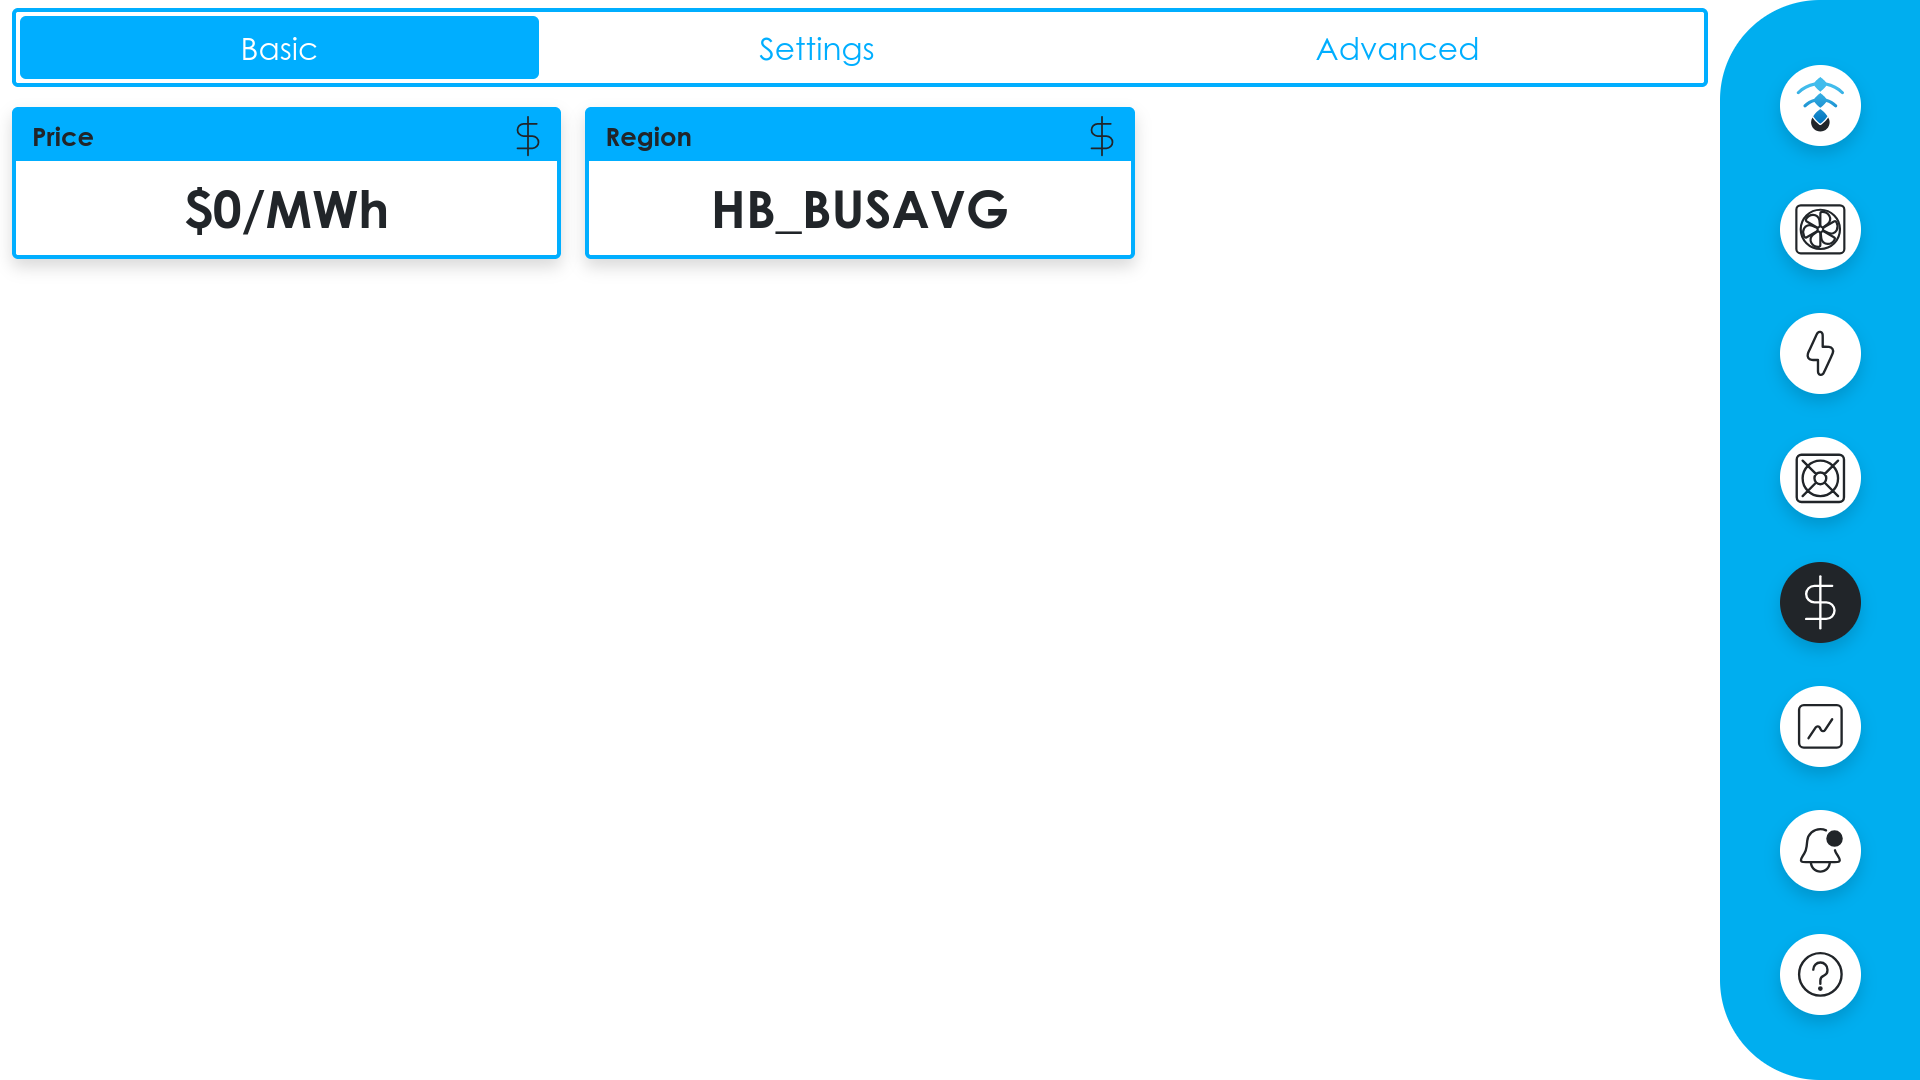
Market sync basic tab
Provides configuration options:
-
Price Limit
Set the price threshold (in $/MWh) at which mining should be paused
-
Sleep Time
Duration (in seconds) to maintain the current state after a price change; set to 0 to disable
-
Auto Balance
Enable or disable automatic market sync response
-
Region
Select your ERCOT pricing region from the dropdown
Available ERCOT regions:
| Hub Regions | Load Zone Regions |
|---|---|
| HB_BUSAVG | LZ_AEN |
| HB_HOUSTON | LZ_CPS |
| HB_HUBAVG | LZ_HOUSTON |
| HB_NORTH | LZ_LCRA |
| HB_PAN | LZ_NORTH |
| HB_SOUTH | LZ_RAYBN |
| HB_WEST | LZ_SOUTH |
| LZ_WEST |
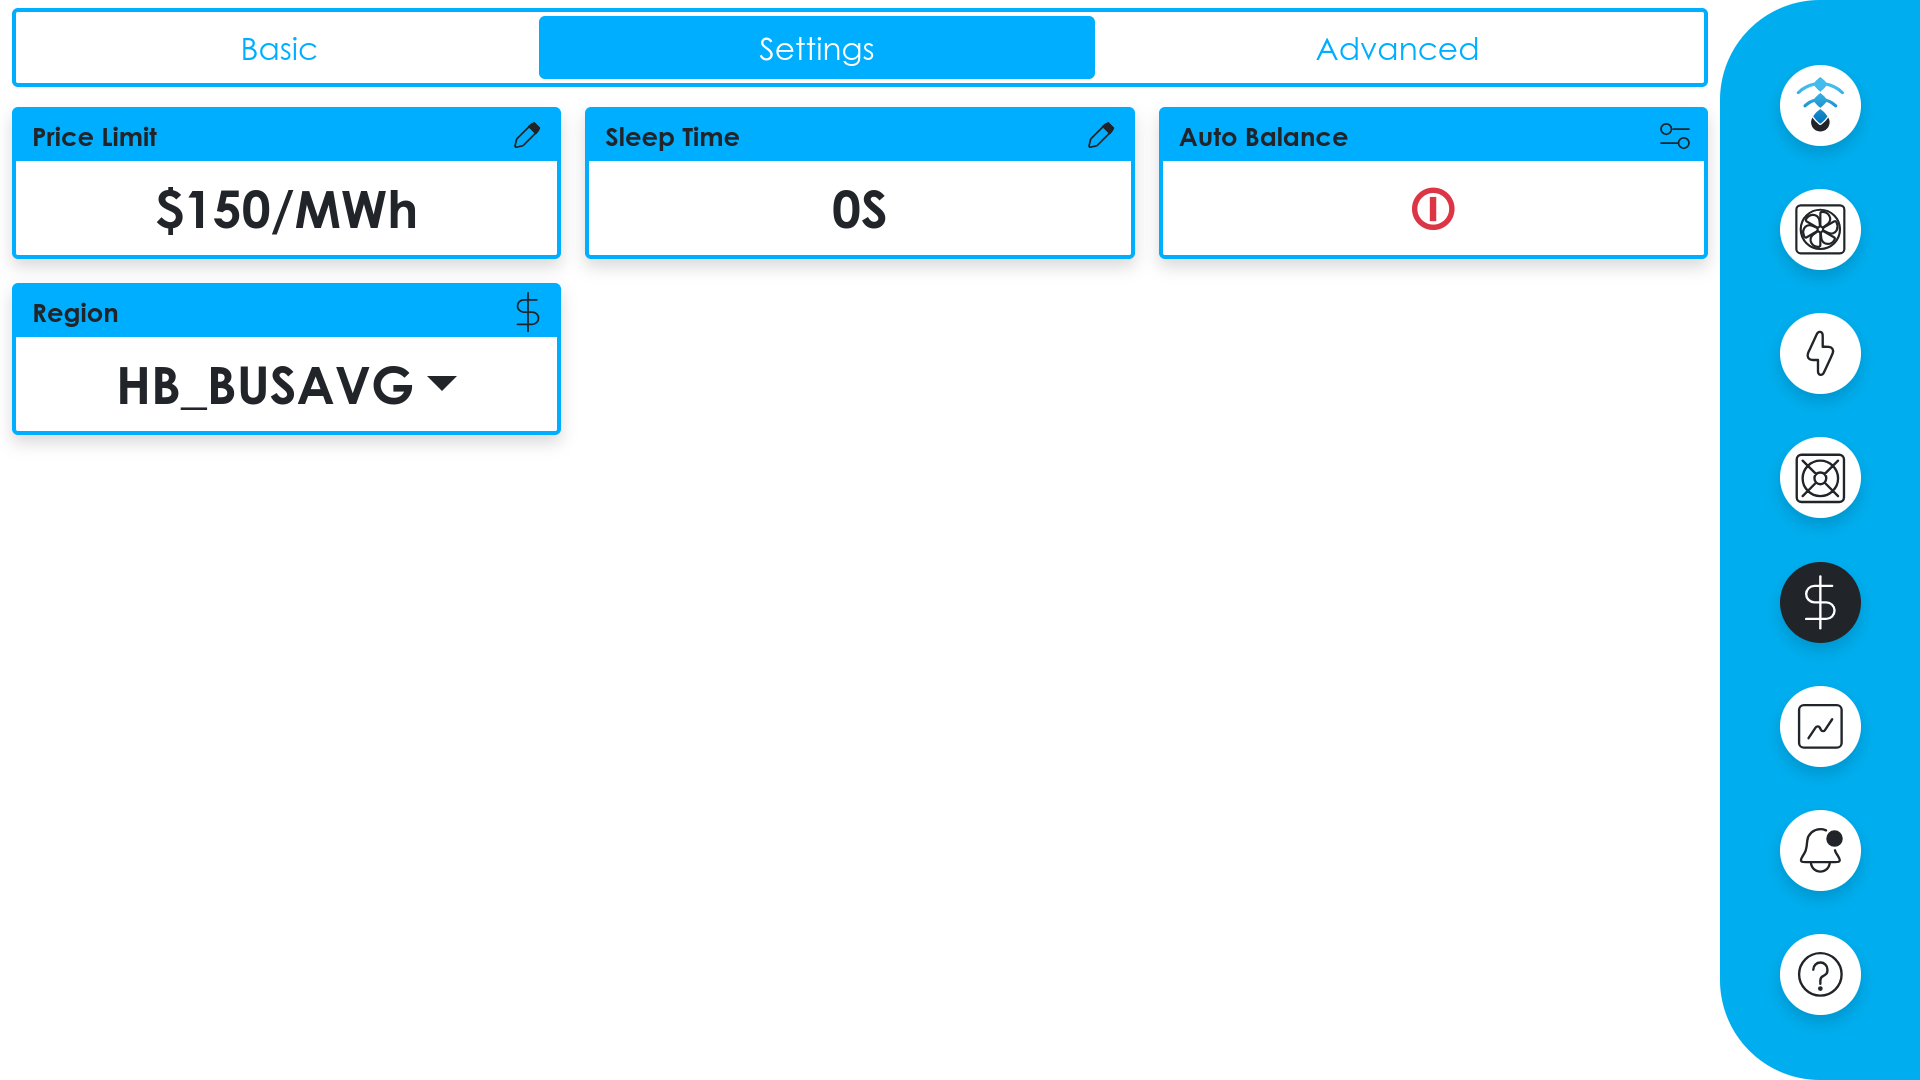
Market sync settings tab
System
The system page provides network information and setup tools, organized into tabs:
Displays the loadcenter's current network configuration including IP address and connection details.
Provides Tailscale VPN setup with a scannable QR code for quick authentication.
Full Setup Guide
See Tailscale Remote Access below for a detailed walkthrough.
Tailscale Remote Access
Tailscale allows for secure, remote access to any miners on a LoadSync™ accessible subnet.
Prerequisites
- Visit tailscale.com/docs/install to download and install the Tailscale client on your computer or mobile device.
- Sign up for a Tailscale account if you don't have one.
Setup
Connecting Tailscale
- On the LoadSync interface, navigate to the System Page and select the Tailscale tab.
- If you do not see a Login QR code, click the New Login button to generate one.
- Scan the QR code with your smartphone and log in using your Tailscale account.
- Once authenticated, press the Connect button on your smartphone device.
Verification
After connecting, the Tailscale State should display as "Running" and your account email will appear in the Profile dropdown.
You may need to enable the routes on the Tailscale web admin panel.
To enable them, click the ... dropdown next to a unit, select Edit route settings..., and ensure the route is enabled under Subnet routes.
More Information
For a detailed walkthrough, see the Tailscale Quickstart Guide.
Fleet Manager
Coming soon.